Reports
User Reports
1. Performance Overview
Manage and monitor salesman performance data, combining transaction data and historical reports.

Support function bar includes:
- View All: Displays a list of reports, supports Excel export.
- Make Report: Support creating reports for sales/BD.
- This Month: Select the report time range (default loads the current month).
- Refresh : Refresh data from Bee Legacy (BFSOne).
2. Sales Performance
Manage and monitor key account sales performance data.
On the left sidebar Report Catalog, select Sales Performance.
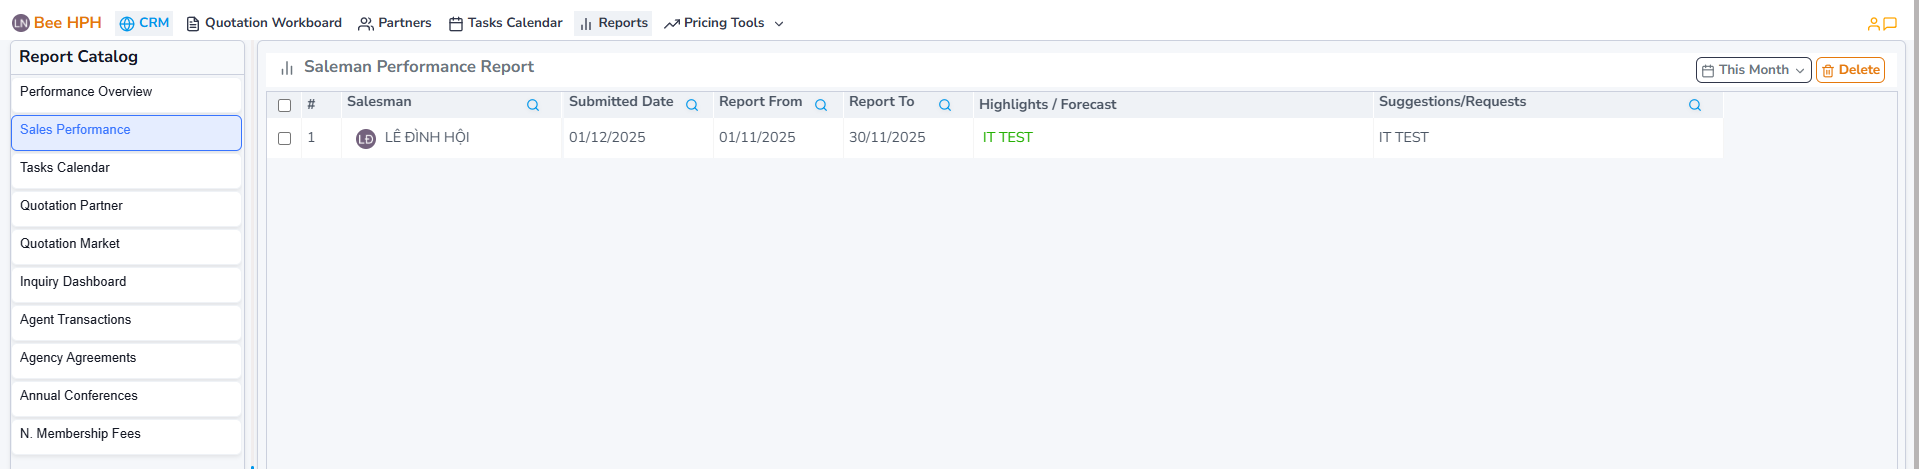
Support function bar includes:
- This Month: Select the report time range (default loads the current month).
- Delete: Delete the selected report.
To view a detailed report on a salesman's performance or edit it, click on the salesman you want to view/edit (column Salesman), fill in the information and then click Save to save the changes.
3. Tasks Calendar
View sales activities such as quotation requests, meeting schedules, training schedules,...
On the left sidebar Report Catalog, select Tasks Calendar.
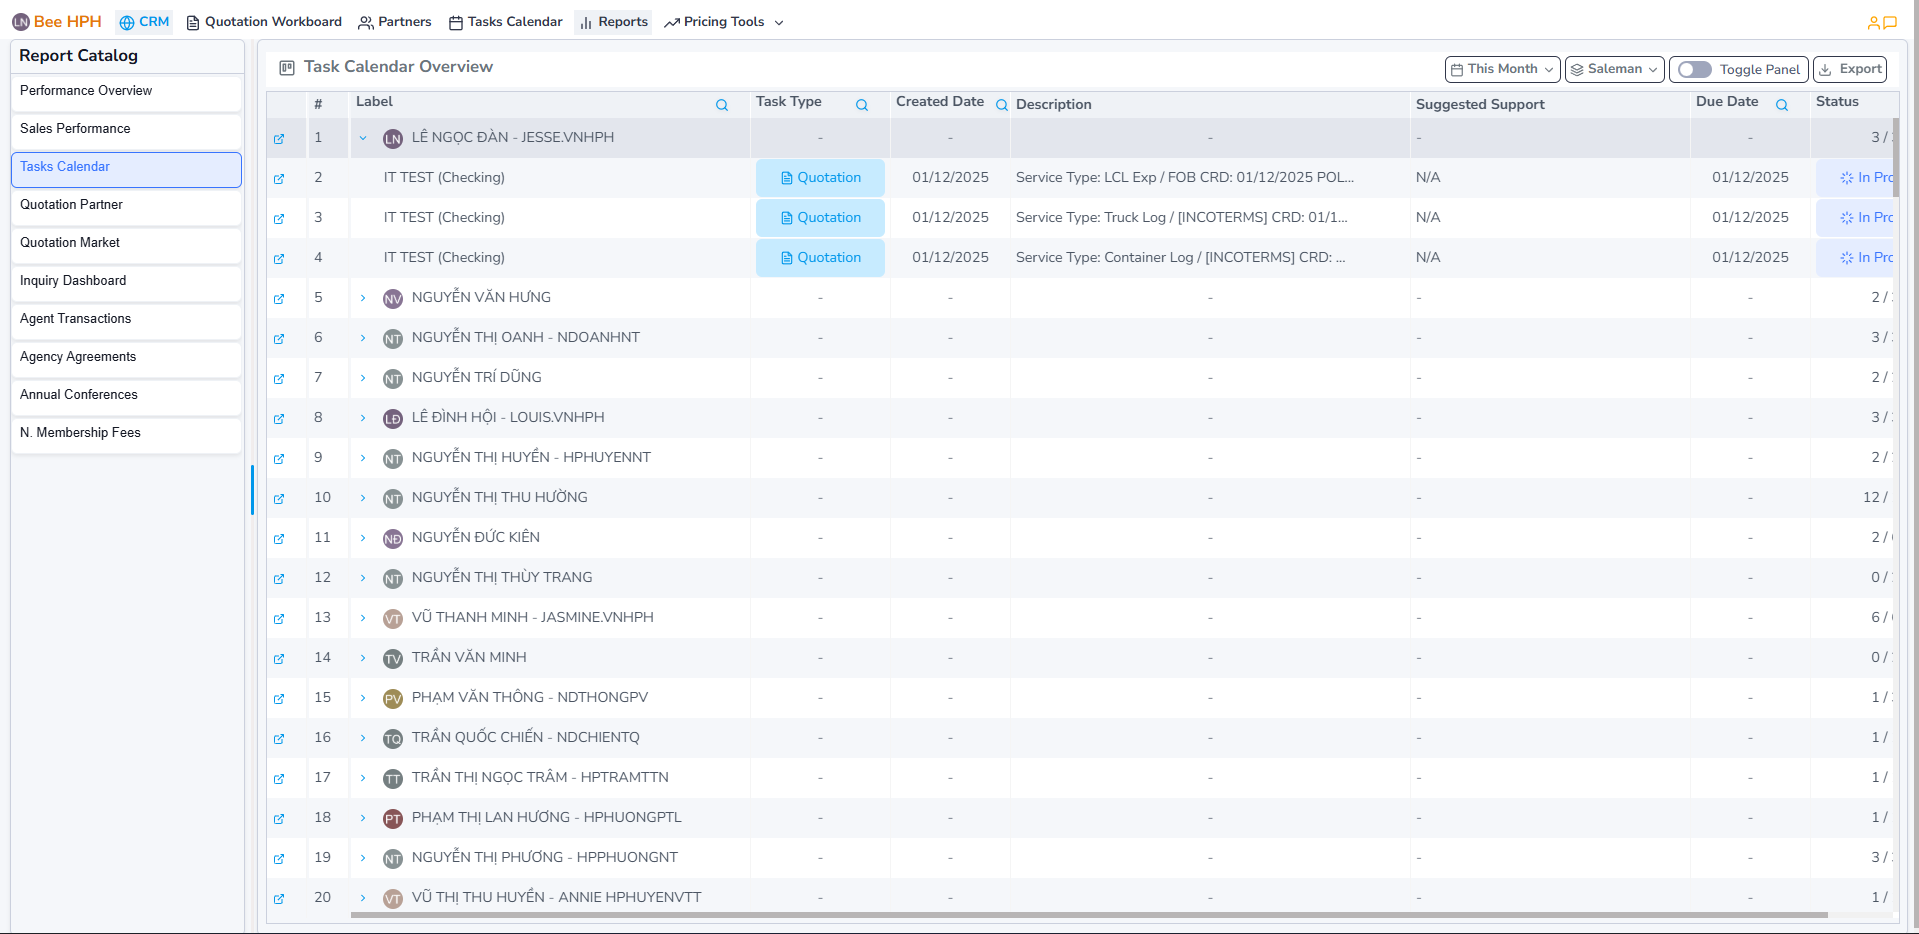
Support function bar includes:
- This Month : Select the report time range (default loads the current month).
- Saleman : Filter by data group (salesman, team, none). Default is salesman.
- Export : Export the report to Excel (based on the data currently shown on screen).
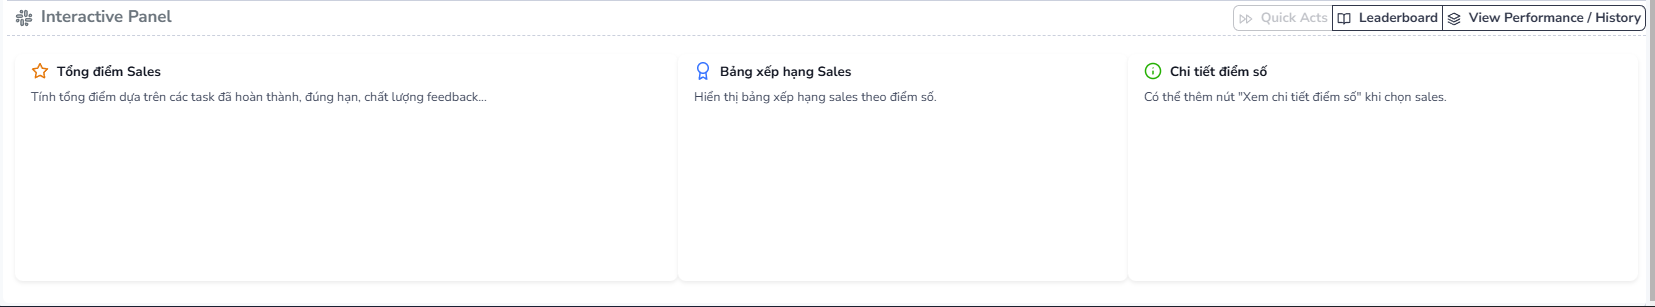
- Toggle Panel : Display the Interactive Panel (provides interactions such as Quick Acts, Leaderboard, View Performance/History).
To edit a record, click the task (Label column), update information, then click Save, click Remove if you want to delete task.
4. Quotation Partners
View aggregated performance data of partners such as: number of quotations, win rate, shipping volume, number of import/export jobs,...
On the left sidebar Report Catalog, select Quotation Partners.
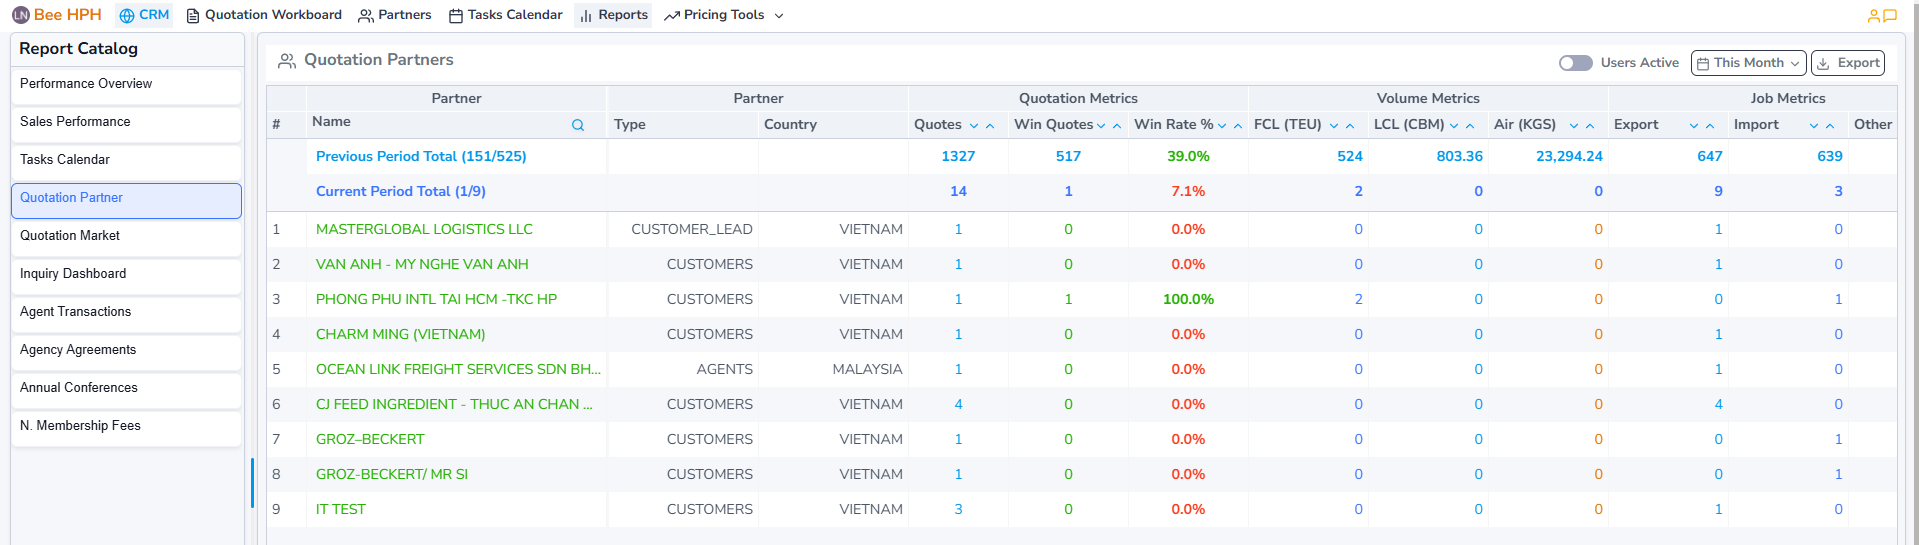
Support function bar includes:
- Users Active : Filter by active users.
- This Month : Select the report time range (default loads the current month).
- Export : Export the report to Excel (based on the data currently shown on screen).
5. Quotation Markets
View aggregated market performance data by country such as: number of quotations, win rate, shipping volume, number of import/export jobs,...
On the left sidebar Report Catalog, select Quotation Markets.
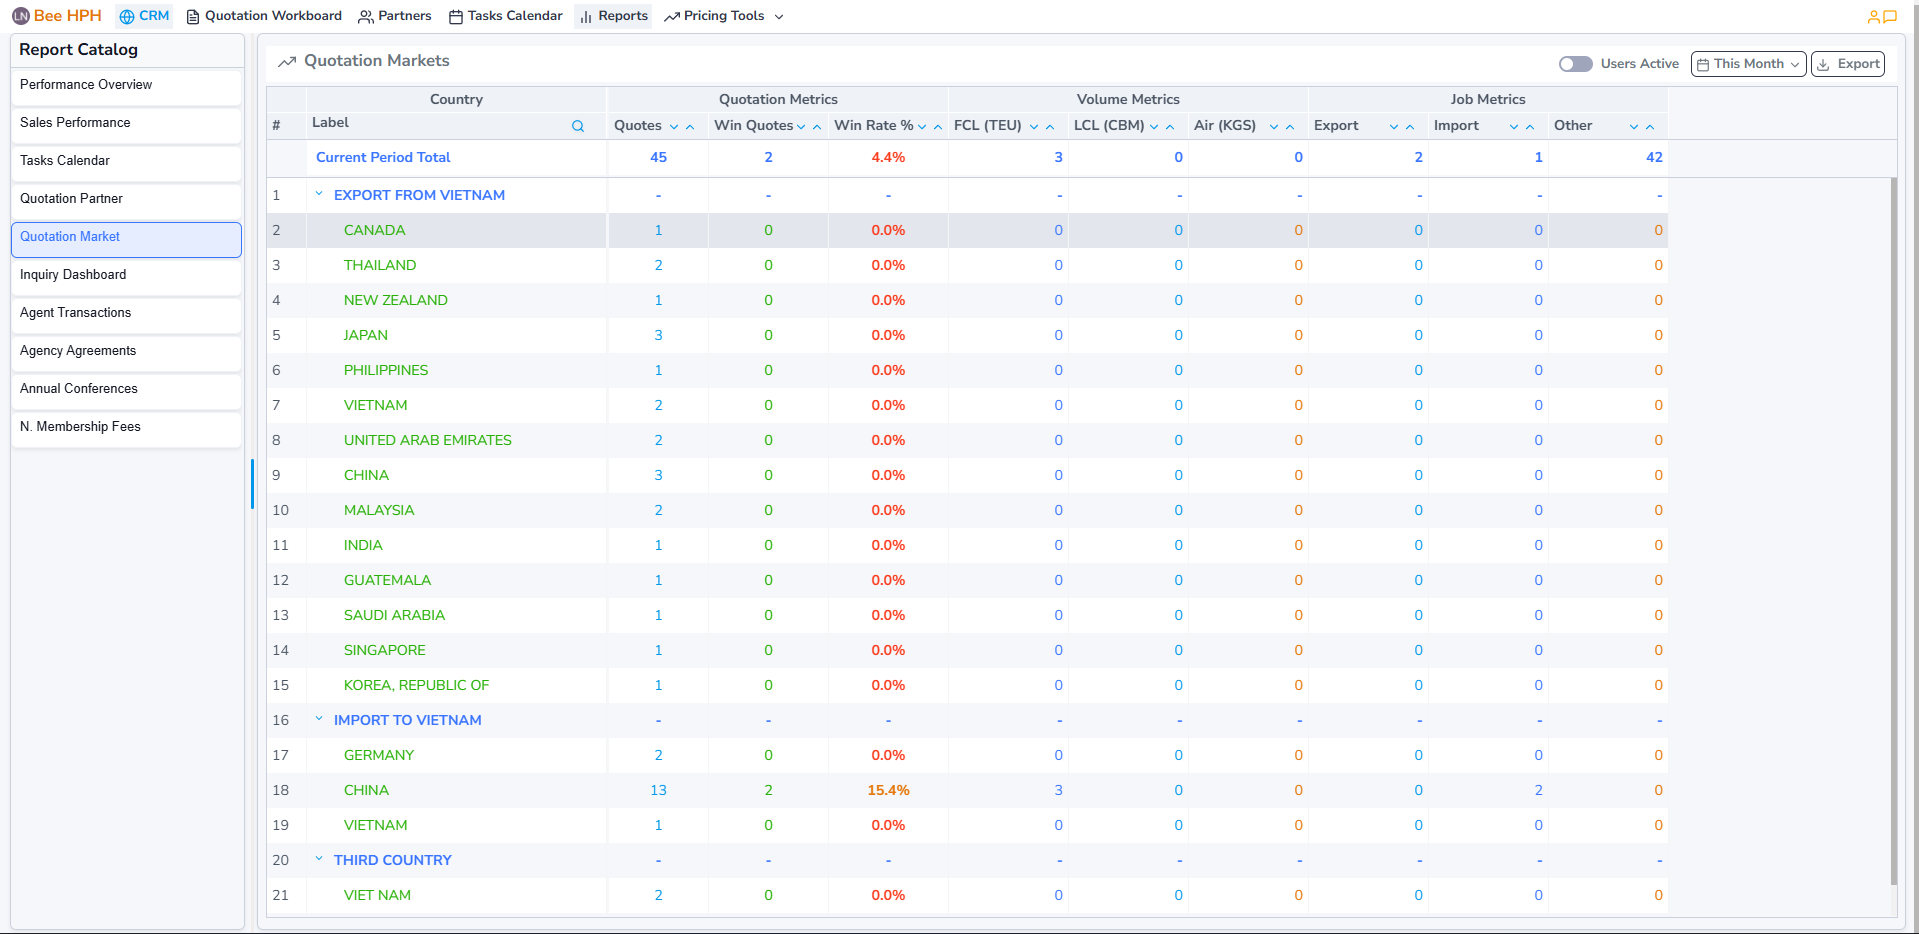
Support function bar includes:
- Users Active : Filter by active users.
- This Month : Select the report time range (default loads the current month).
- Export : Export the report to Excel (based on the data currently shown on screen).
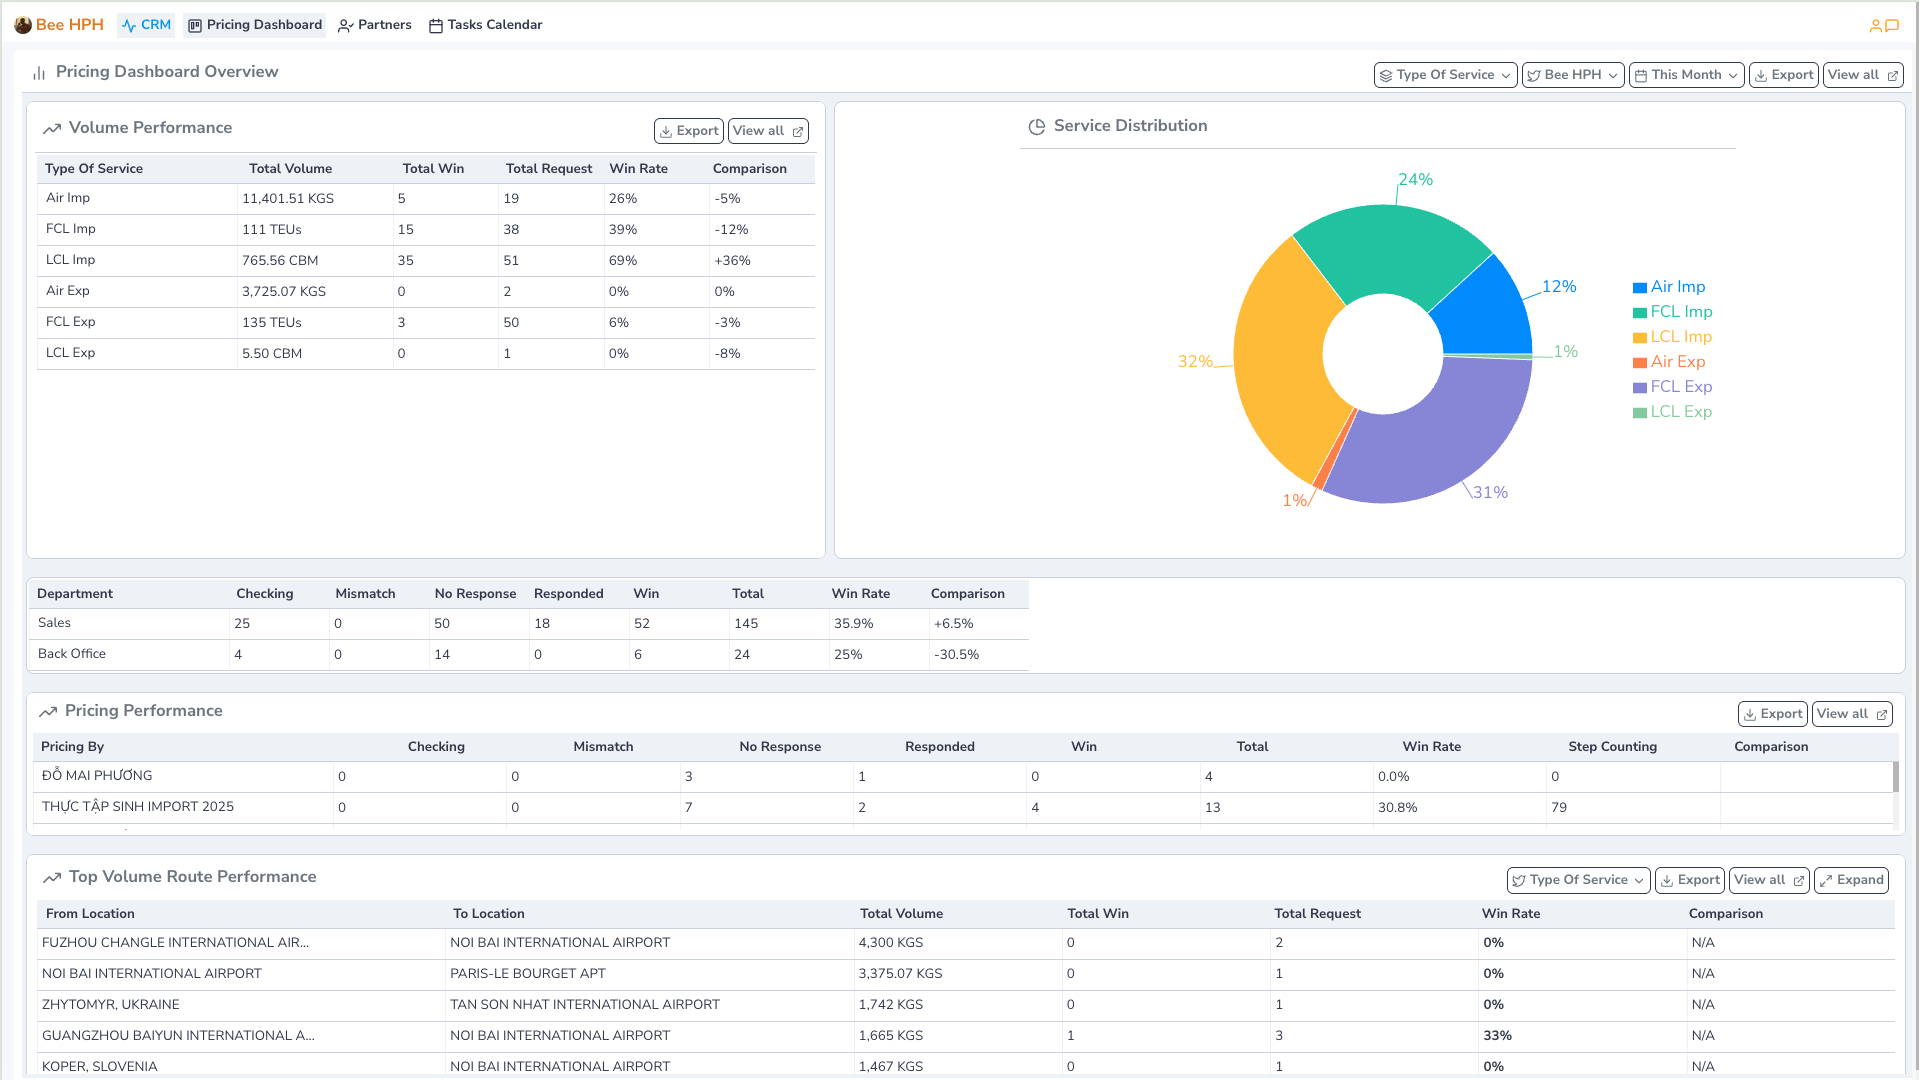
6. Inquiry Dashboard
View status reports, win rate, and volume of Inquiry from different dimensions such as service type, route, salesman, pricing,...
On the left sidebar Report Catalog, select Inquiry Dashboard.
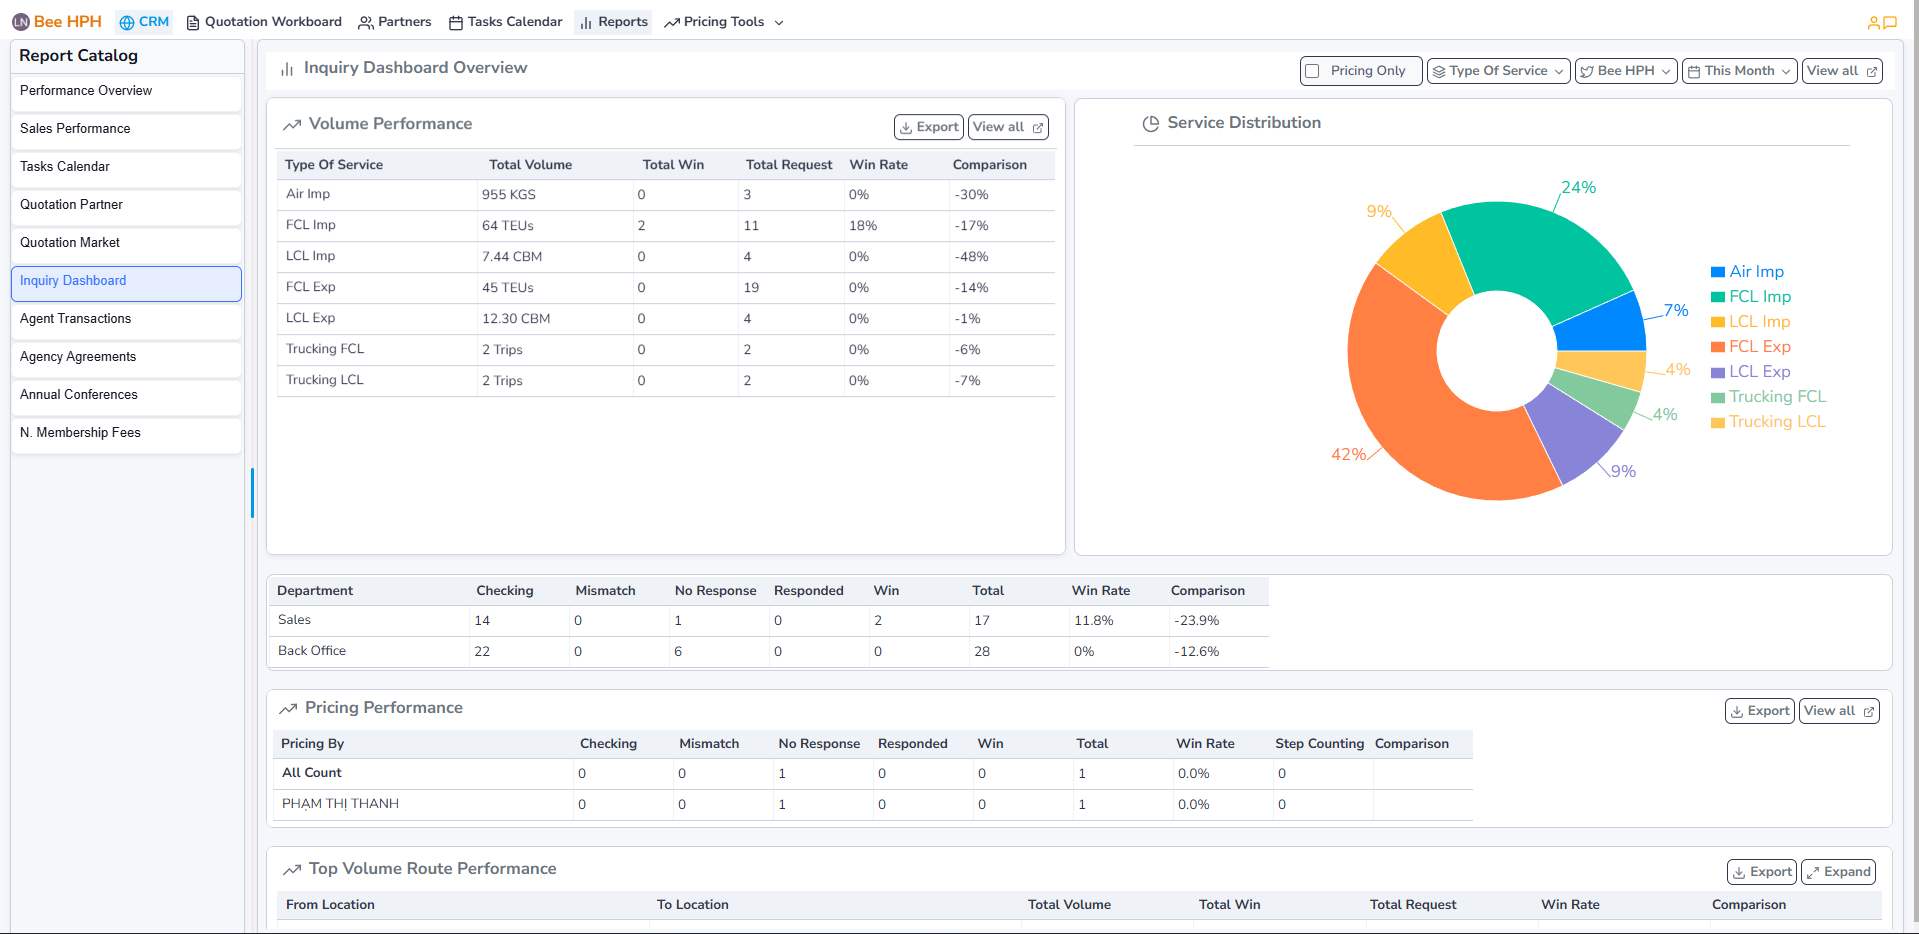
Support function bar includes:
- Pricing Only : Filter by pricing.
- Type Of Service : Filter by service type.
- Bee HPH : Select company/branch to display data (default is the branch of the logged-in user).
- This Month : Select the report time range (default loads the current month).
- Export : Export the report to Excel (based on the data currently shown on screen).
- View all : View raw data (all Inquiry Requests).
- Expand : View raw data, expand the list view to full screen.
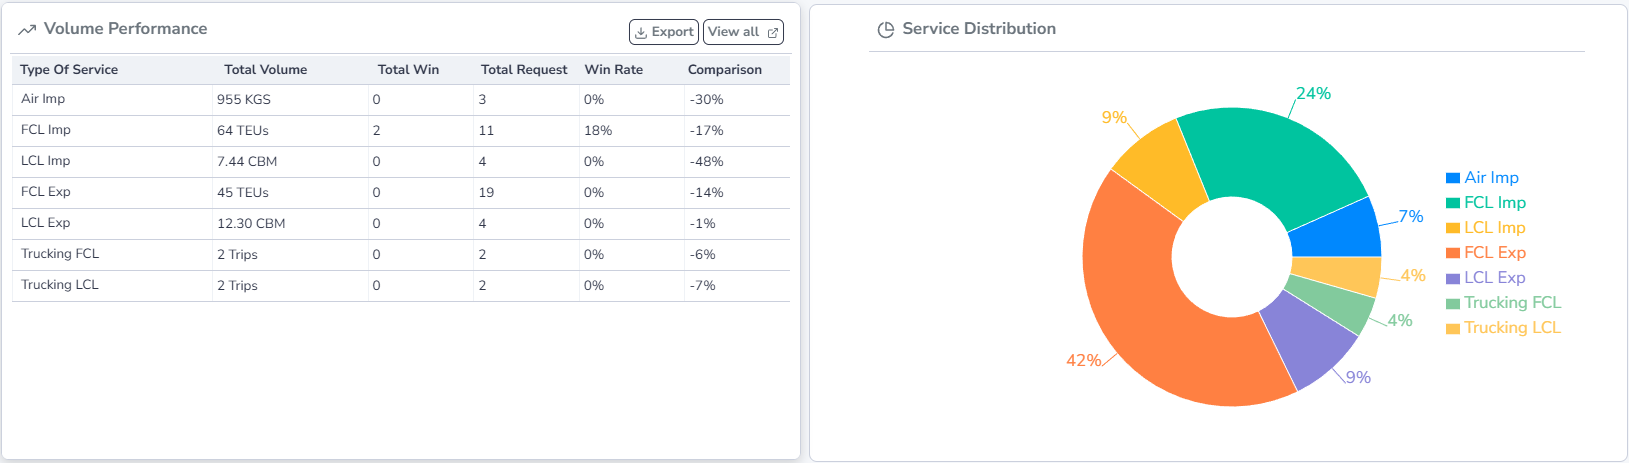
1.1. Volume Performance:
View volume summary by each service type.
To see a detailed list of quotes for each type of service, click to select the type of service you want to view (column Type Of Service). In addition, it also supports creating quotes for bulk goods, exporting Excel files and deleting selected quotes, changing the status of quotes.
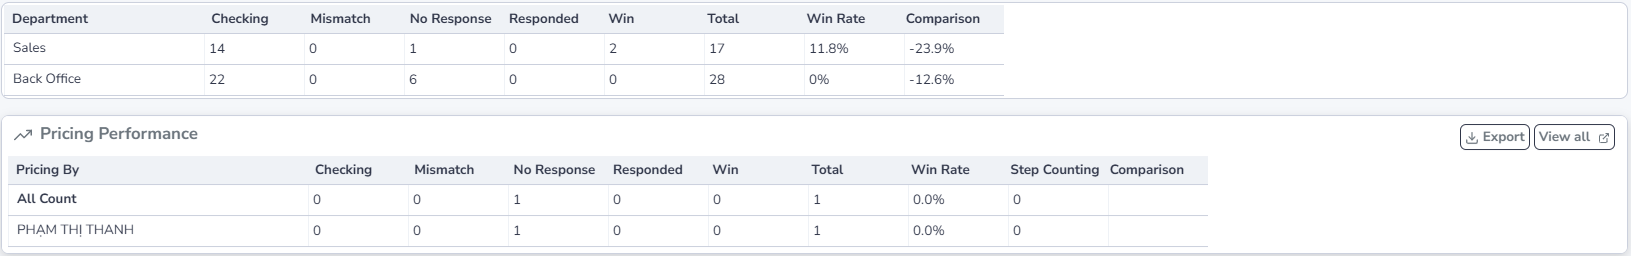
1.2. Department/ Pricing Performance:
View volume summary by each department, or by each Pricing Specialist.
To see the detailed list of volumes by each department, click on the department you want to view (column Department), which supports Excel file export.
To see detailed list of volumes by each Pricing Specialist, click to select the Pricing Specialist you want to view (column Pricing By). In addition, it also supports creating quotes for bulk goods, exporting Excel files and deleting selected quotes, changing the status of quotes.
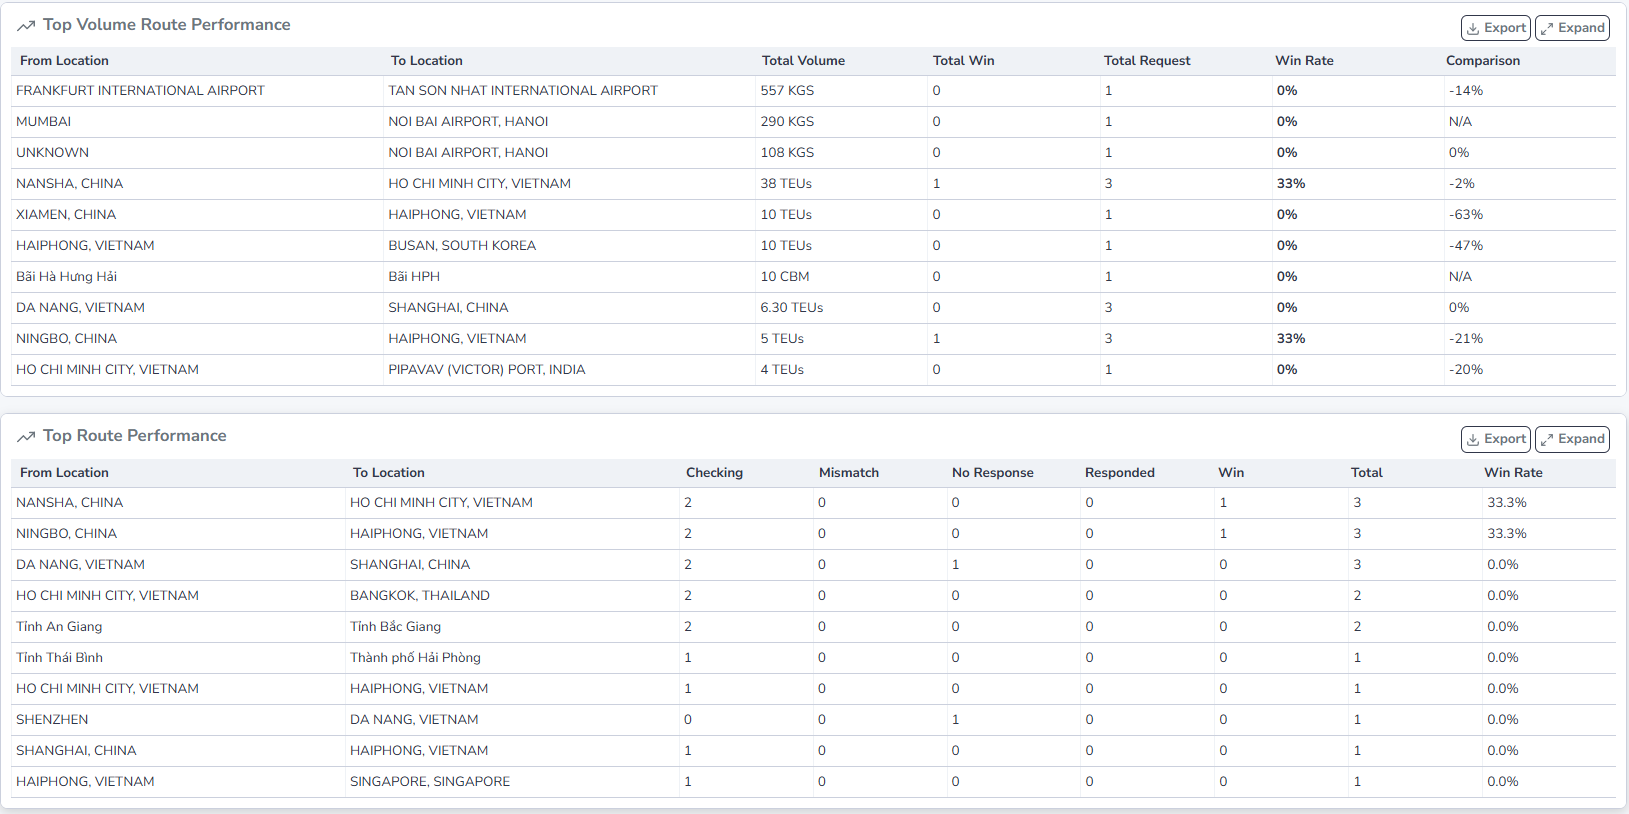
1.3. Top Volume/ Top Route: View volume summary, win rate by each route.
7. Agent Transactions
View aggregated transaction data of agents grouped by agent, country, or network.
On the left sidebar Report Catalog, select Agent Transactions.

Support function bar includes:
- Agent : Choose how to group the data (agent, country, network). Default is agent.
- Report Filter : Filter data by partner name/code or location code.
- This Month : Select the report time range (default loads the current month).
- Export : Export the report to Excel (based on the data currently shown on screen).
To view agent's transactions detail, click the agent (Hierarchy column).
8. Agency Agreements
Manage and monitor agent-related follow-ups such as tracking/changing status, setting schedule and notification recipients.
On the left sidebar Report Catalog, select Agent Agreements.
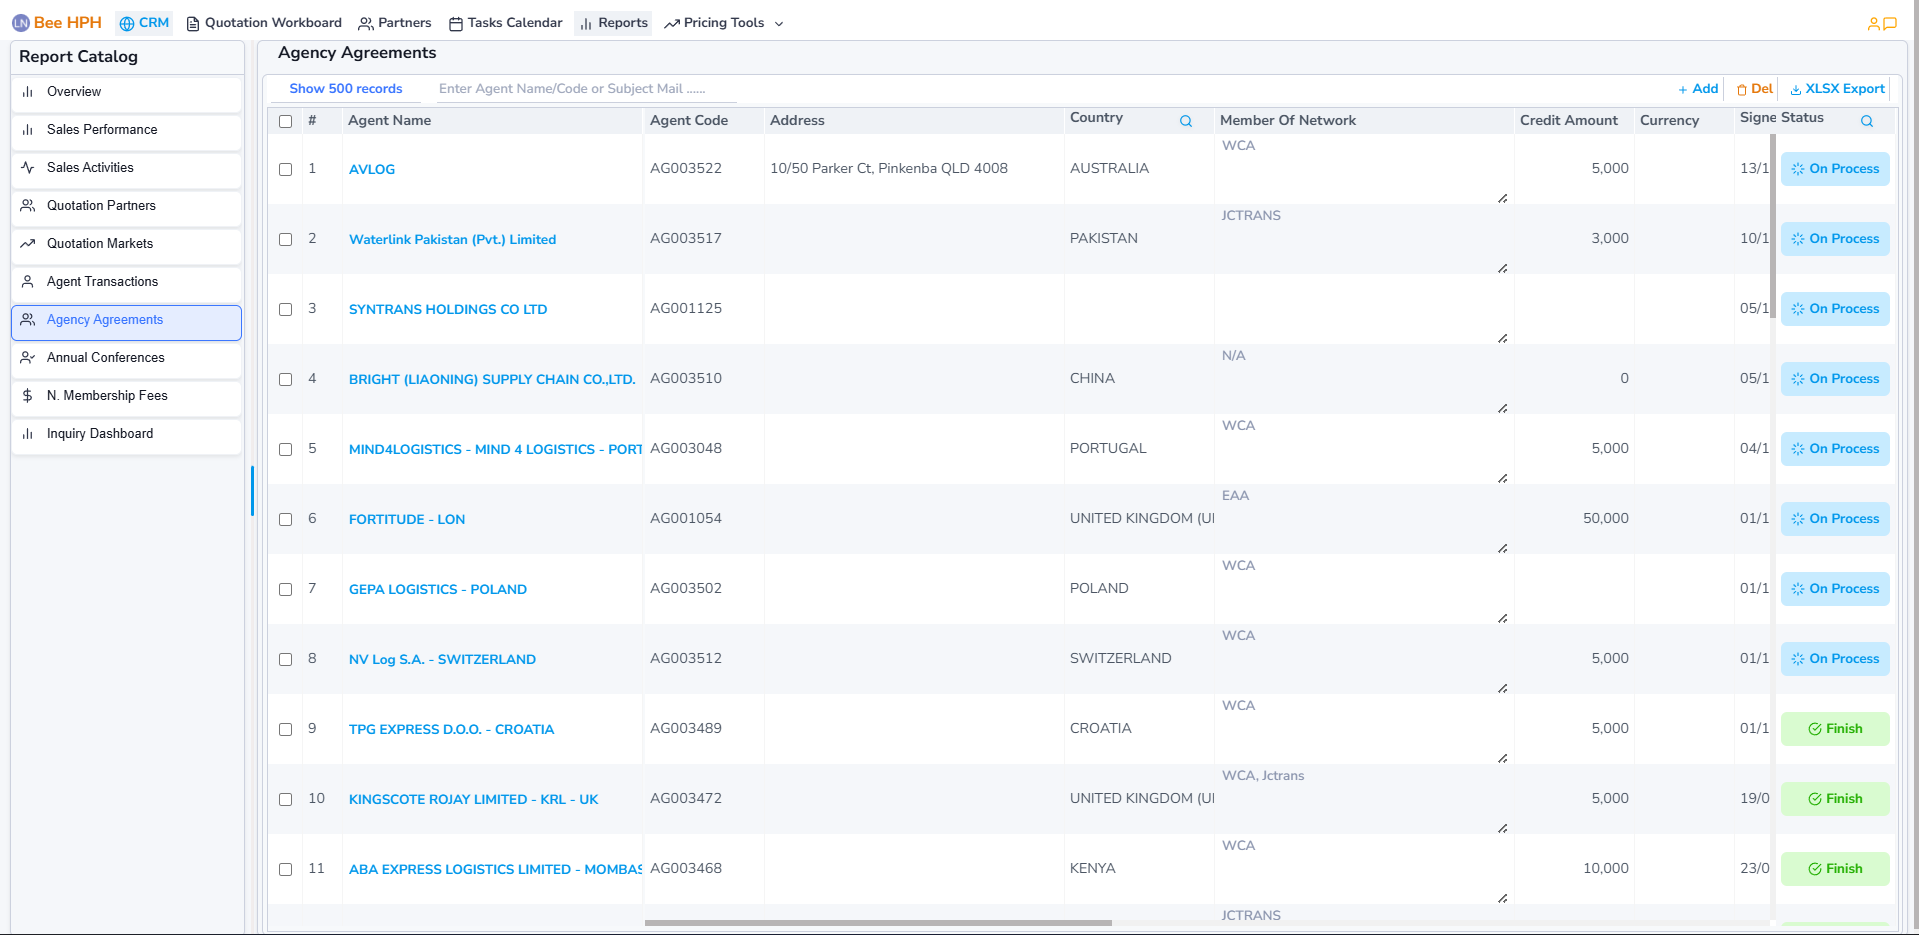
Support function bar includes:
- Add/Del : Add or delete follow-up items.
- XLSX Export : Export the report to Excel (based on the data currently shown on screen).
- Also supports limiting the number of displayed records and searching by agent name or email subject.
To edit follow-up information, click the agent name (Agent Name column), update the fields, then click Save.
9. Annual Conferences
Manage and monitor information regarding annual conferences.
On the left sidebar Report Catalog, select Annual Conferences.
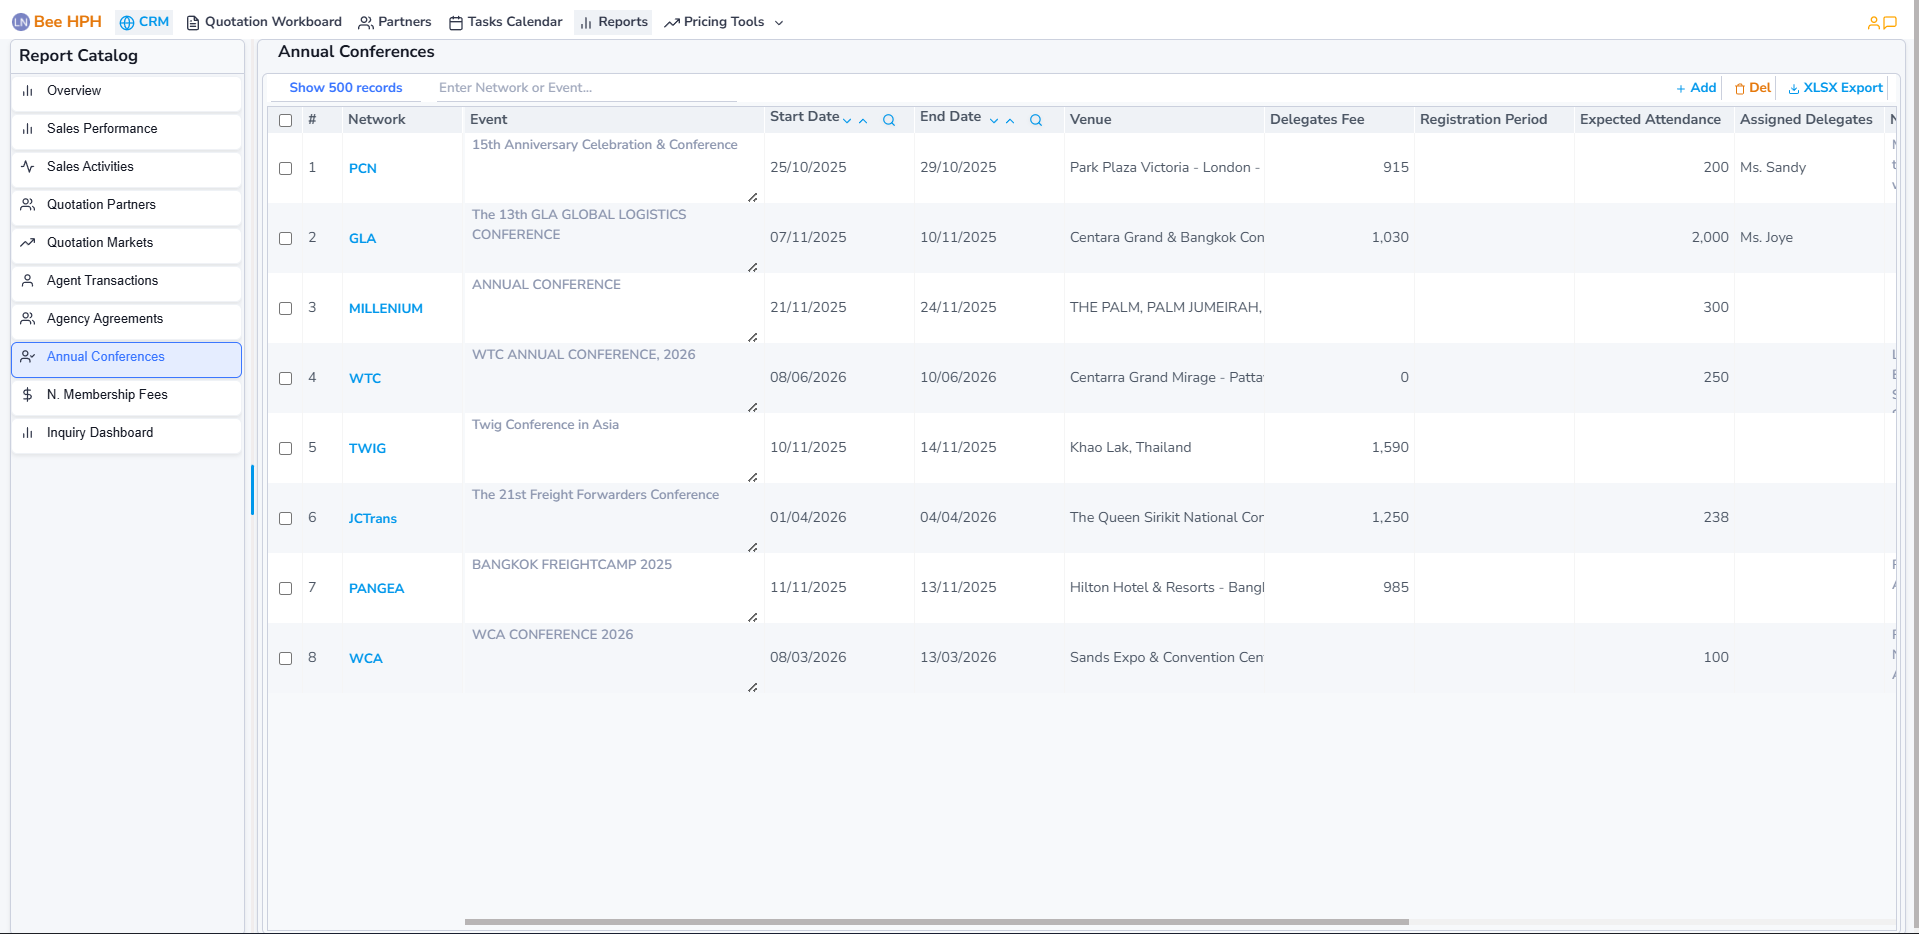
Support function bar includes:
- Add/Del : Add or delete records.
- XLSX Export : Export the report to Excel (based on the data currently shown on screen).
- Also supports limiting the number of displayed records and searching by network or event.
To edit a record, click the network (Network column), update the information, then click Save.
10. N. Membership Fees
Manage and monitor membership fee information within the network.
On the left sidebar Report Catalog, select N. Membership Fees.
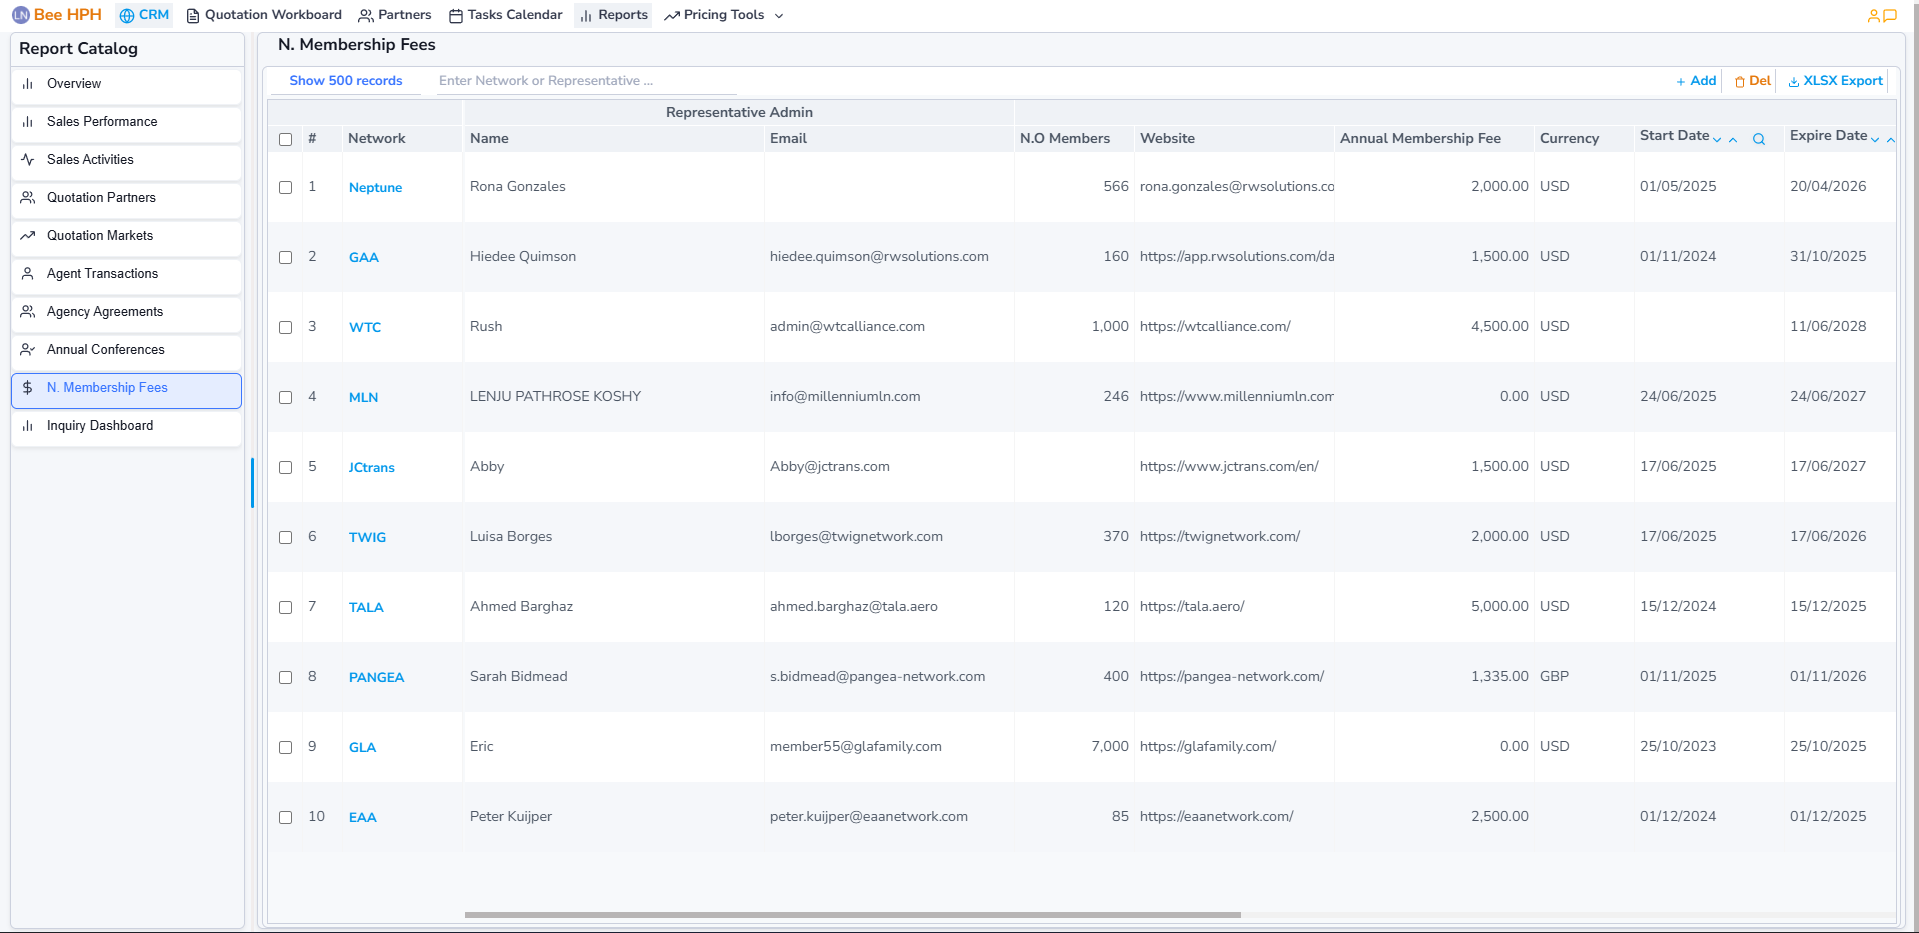
Support function bar includes:
- Add/Del : Add or delete records.
- XLSX Export : Export the report to Excel (based on the data currently shown on screen).
- Also supports limiting the number of displayed records and searching by network or event.
To edit a record, click the network (Network column), update the information, then click Save.
Company Reports
1. Performance Overview
Similar to User Reports - Performance Overview but limited by branch.

2. Sales Performance
Similar to User Reports - Sales Performance but limited by branch.
On the left sidebar Report Catalog, select Sales Performance

Support function bar includes:
- This Month : Select the report time range (default loads the current month).
- Saleman : Filter by data group (salesman, team, none). Default is salesman.
3. Tasks Calendar
Similar to User Reports - Tasks Calendar but limited by branch.
On the left sidebar Report Catalog, select Tasks Calendar

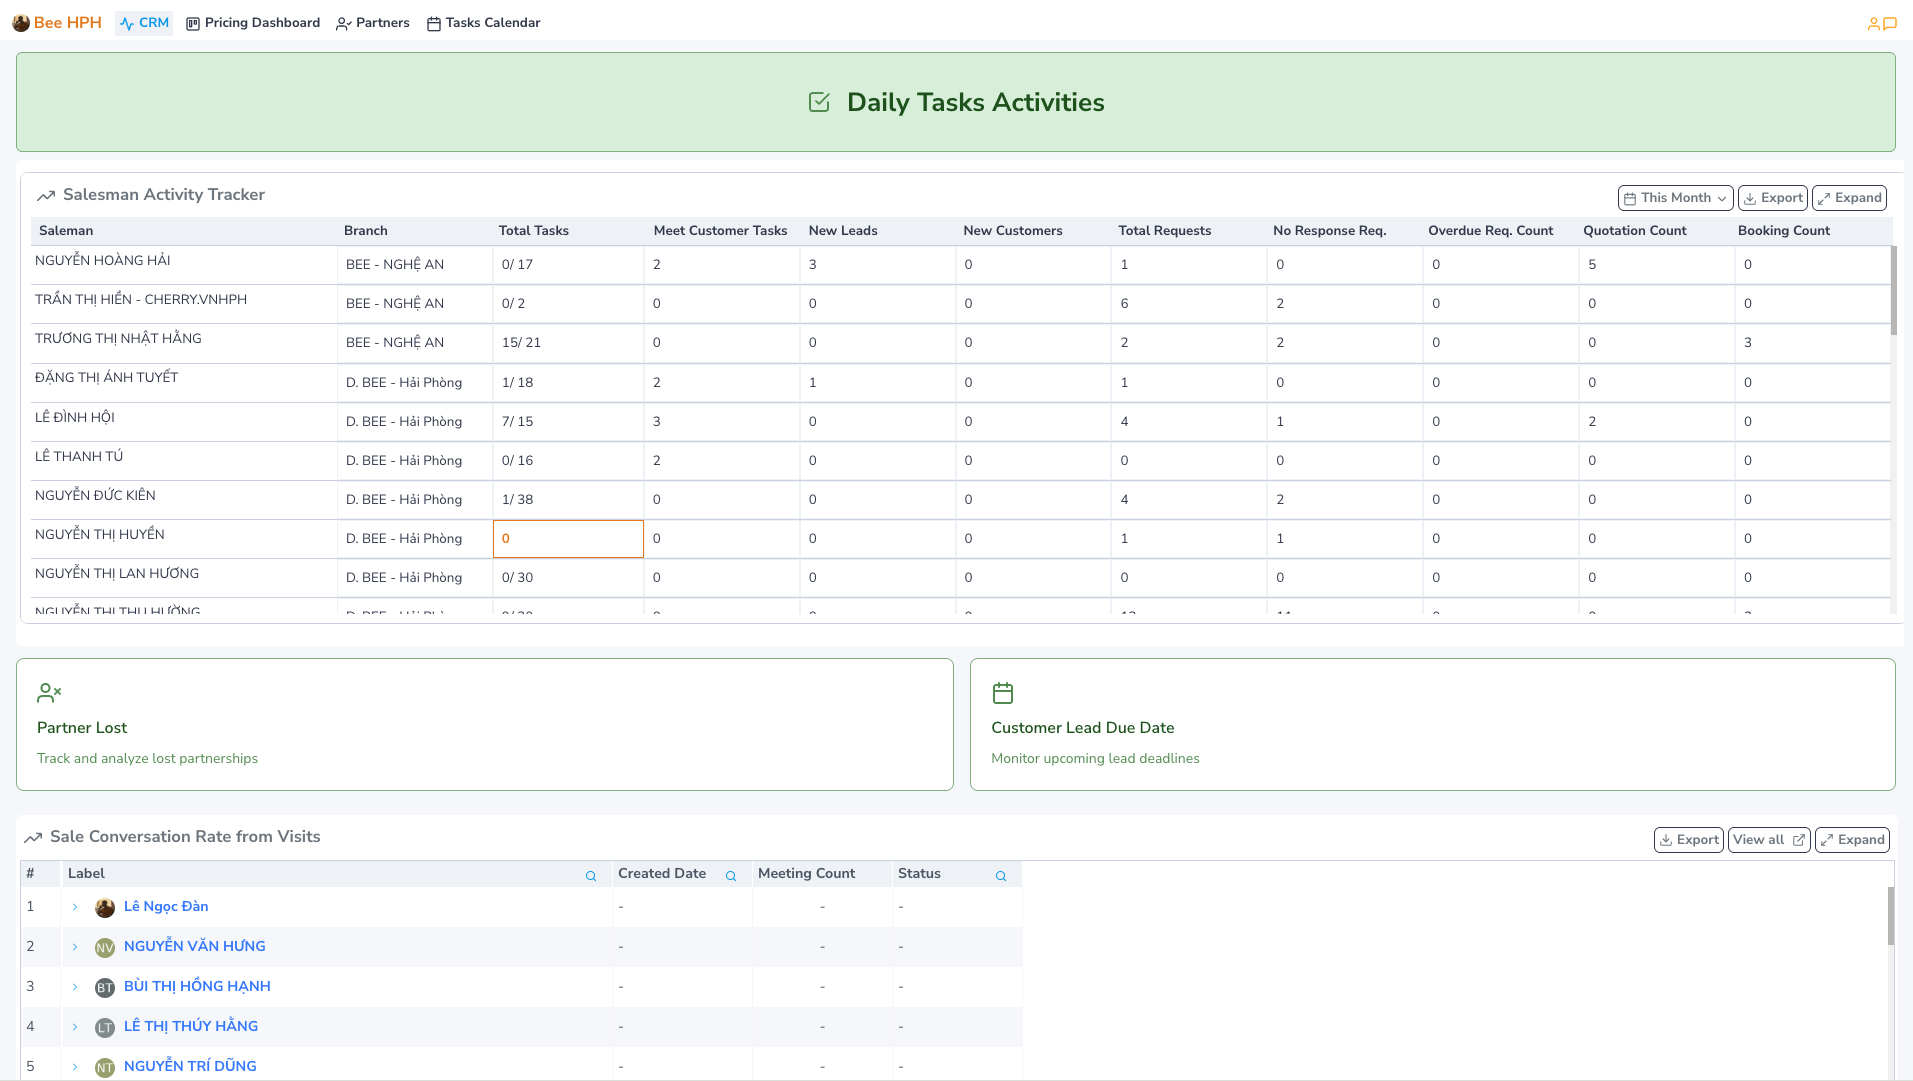
4. Salesman Tracker
On the left sidebar Report Catalog, select Salesman Tracker
Summarizes activity metrics of each salesman, including:
- Saleman/ Branch : Salesman and branch information.
- Total Tasks : Total number of tasks – summarized from
Daily Tasks (In Progress / Total). - Meet Customer Tasks : Total customer-meeting related tasks – summarized from
Daily Tasks. - New Leads/ New Customers: Total new customers (created or transferred) and new leads (created in CRM).
- Total Requests: Total inquiry requests collected from the system (includes pricing check requests and automatically created requests when generating quotations).
- No Response Req.: Number of requests not yet responded from customers, no Win/ Mismatch/… status updated.
- Overdue Req. Count.: Number of times the system sent reminder emails for overdue customer responses.
- Quotation Count.: Number of quotation exports.
- Booking Count.: Number of successfully created internal bookings.
Support function bar includes:
- This Month : Select the report time range (default loads the current month).
- Export : Export the report to Excel (based on the data currently shown on screen).
- Expand : View raw data, expand the list view to full screen.
![]()
For some metrics, you can click on them to view detailed data. In addition, it also supports add/del, export Excel's file.
![]()
5. Quotation Summaries
View summarized metrics and evaluate the sales performance of each salesman based on quotations: number of inquiries, win rate, shipment volume,...
On the left sidebar Report Catalog, select Quotation Summaries
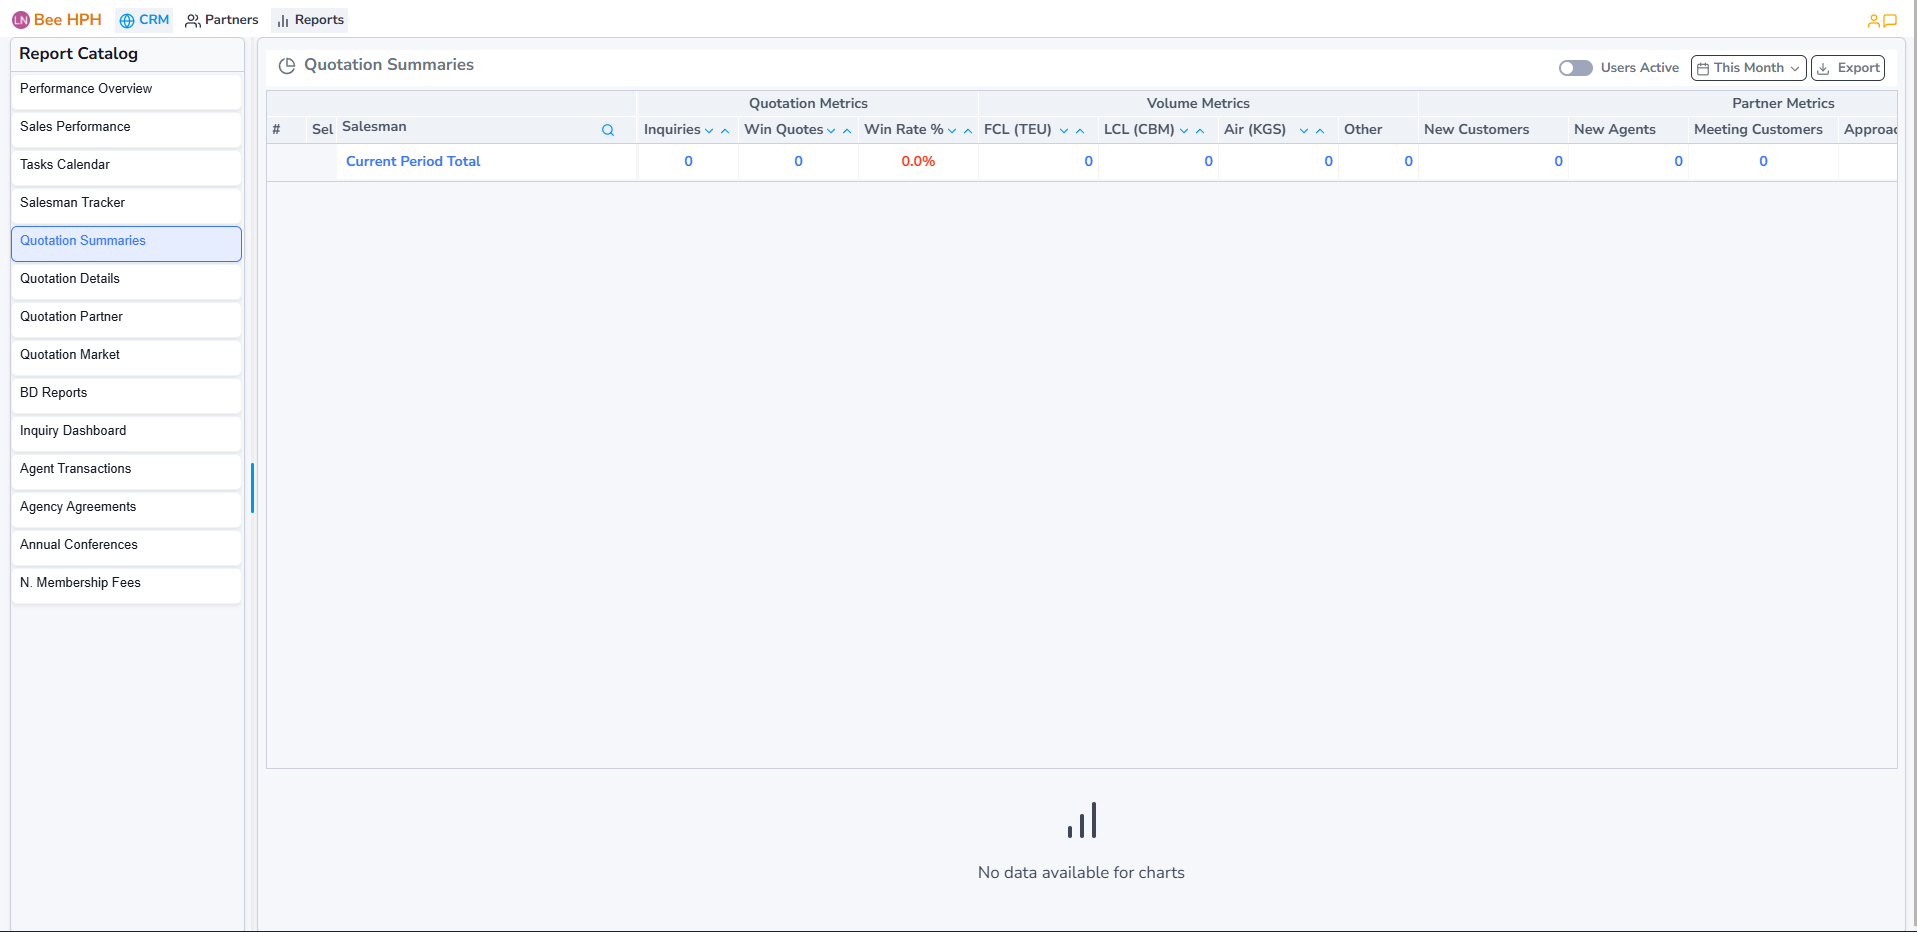
Support function bar includes:
- Users Active : Filter by active users.
- This Month : Select the report time range (default loads the current month).
- Export : Export the report to Excel (based on the data currently shown on screen).
- View All : Select all users in the
Quotation Summariestable to compare in theSalesman Performance Overviewchart. - Clear All : Unselect all users chosen via
View All, return to default data forSalesman Performance Overviewchart.
5.1. Quotation Summaries
- Quotation Metrics: Metrics such as
Inquiries,Win Quotes,Win Rate %. - Volume Metrics: Shipment metrics such as
FCL (TEU),LCL (CBM),Air (KGS),Other. - Partner Metrics: Partner development metrics such as
New Customers,New Agents,Meeting Customers. - Displays totals for the current and previous periods for easy comparison.

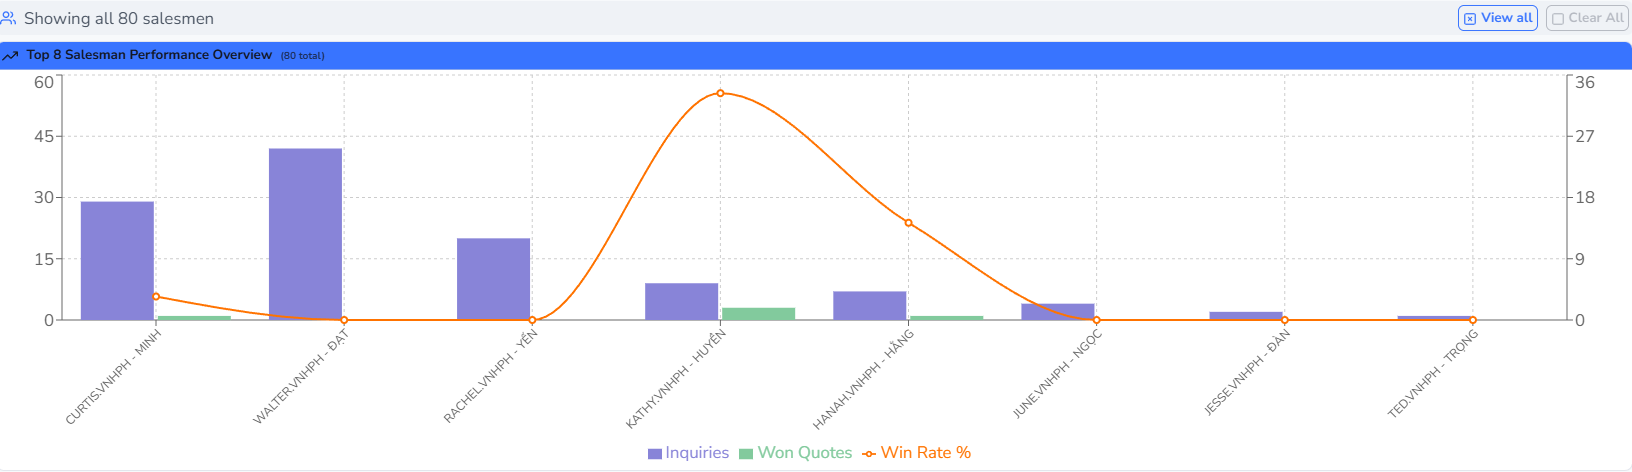
5.2. Salesman Performance Overview
- Salesman Performance Overview: A combined chart showing overall performance of top salesman (or selected salesman).
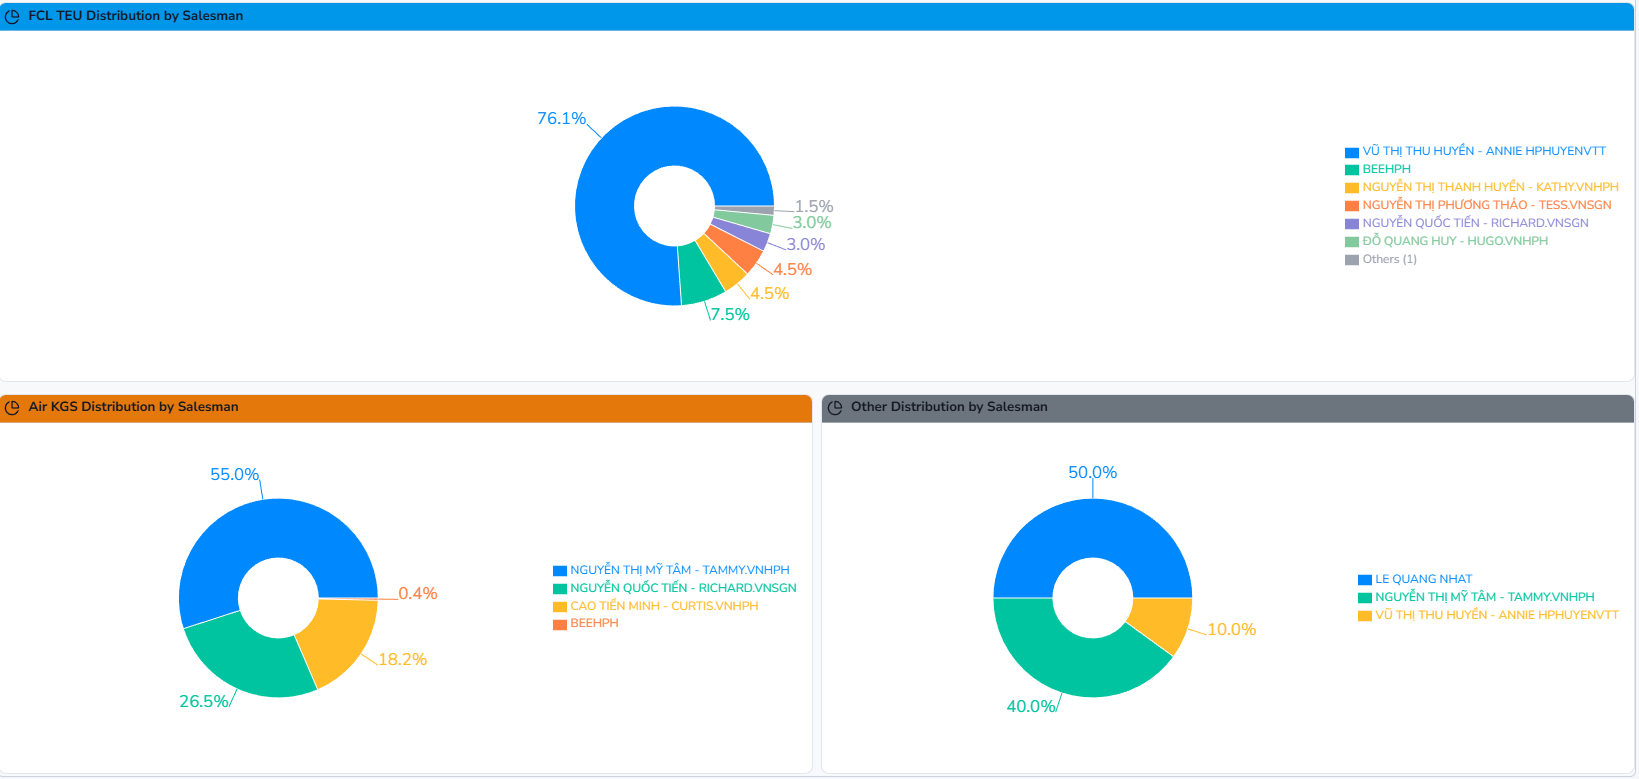
5.3. Distribution
- Volume Distribution: Pie charts showing the distribution of volume (TEU, CBM, KGS) by salesman.
6. Quotation Details
View detailed sales performance reports for each salesman.
On the left sidebar Report Catalog, select Quotation Details.
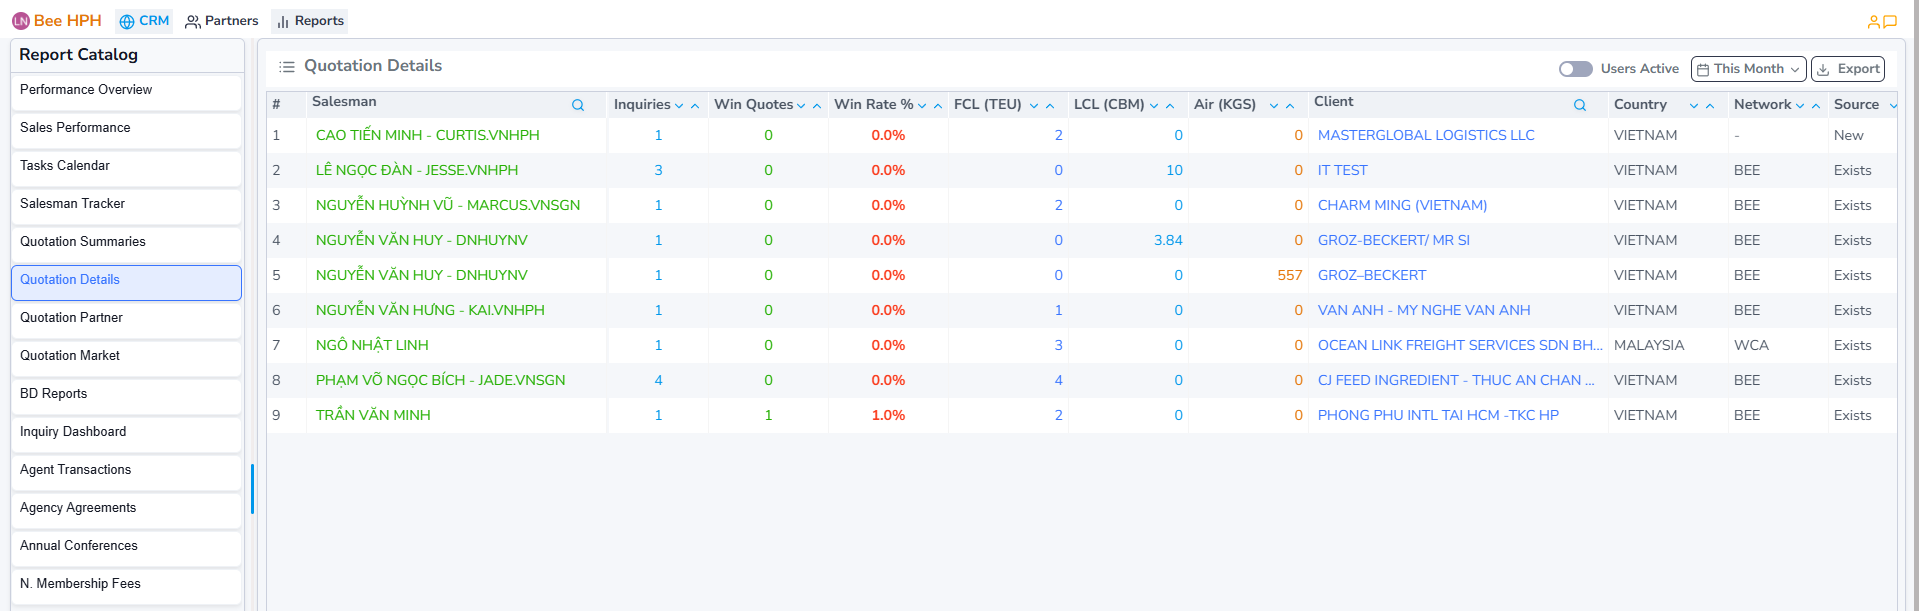
Support function bar includes:
- Users Active : Filter by active users.
- This Month : Select the report time range (default loads the current month).
- Export : Export the report to Excel (based on the data currently shown on screen).
7. Quotation Partners
Similar to User Reports - Quotation Partners but limited by branch.
On the left sidebar Report Catalog, select Quotation Partners
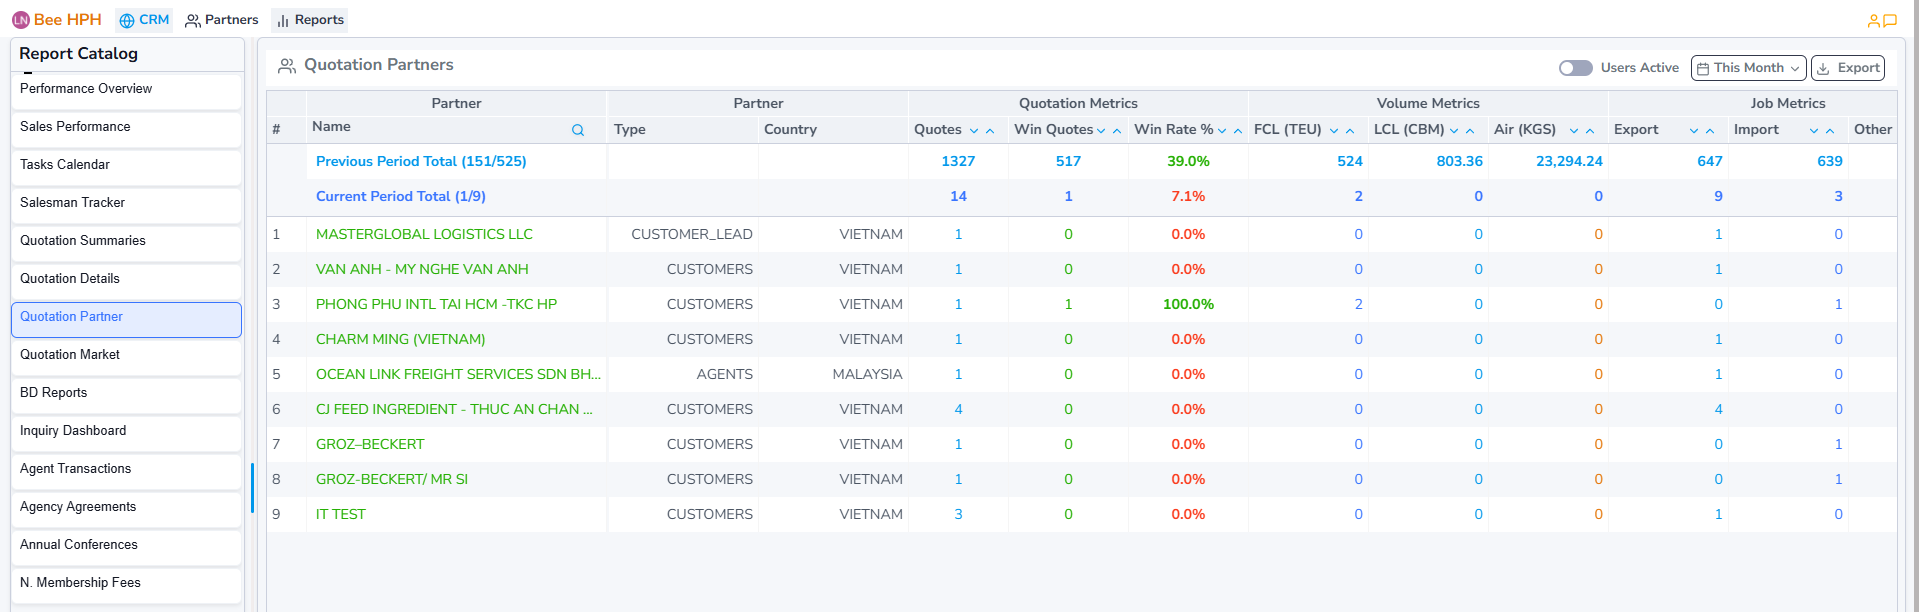
Support function bar includes:
- Users Active : Filter by active users.
- This Month : Select the report time range (default loads the current month).
- Export : Export the report to Excel (based on the data currently shown on screen).
8. Quotation Markets
Similar to User Reports - Quotation Markets but limited by branch.
On the left sidebar Report Catalog, select Quotation Markets
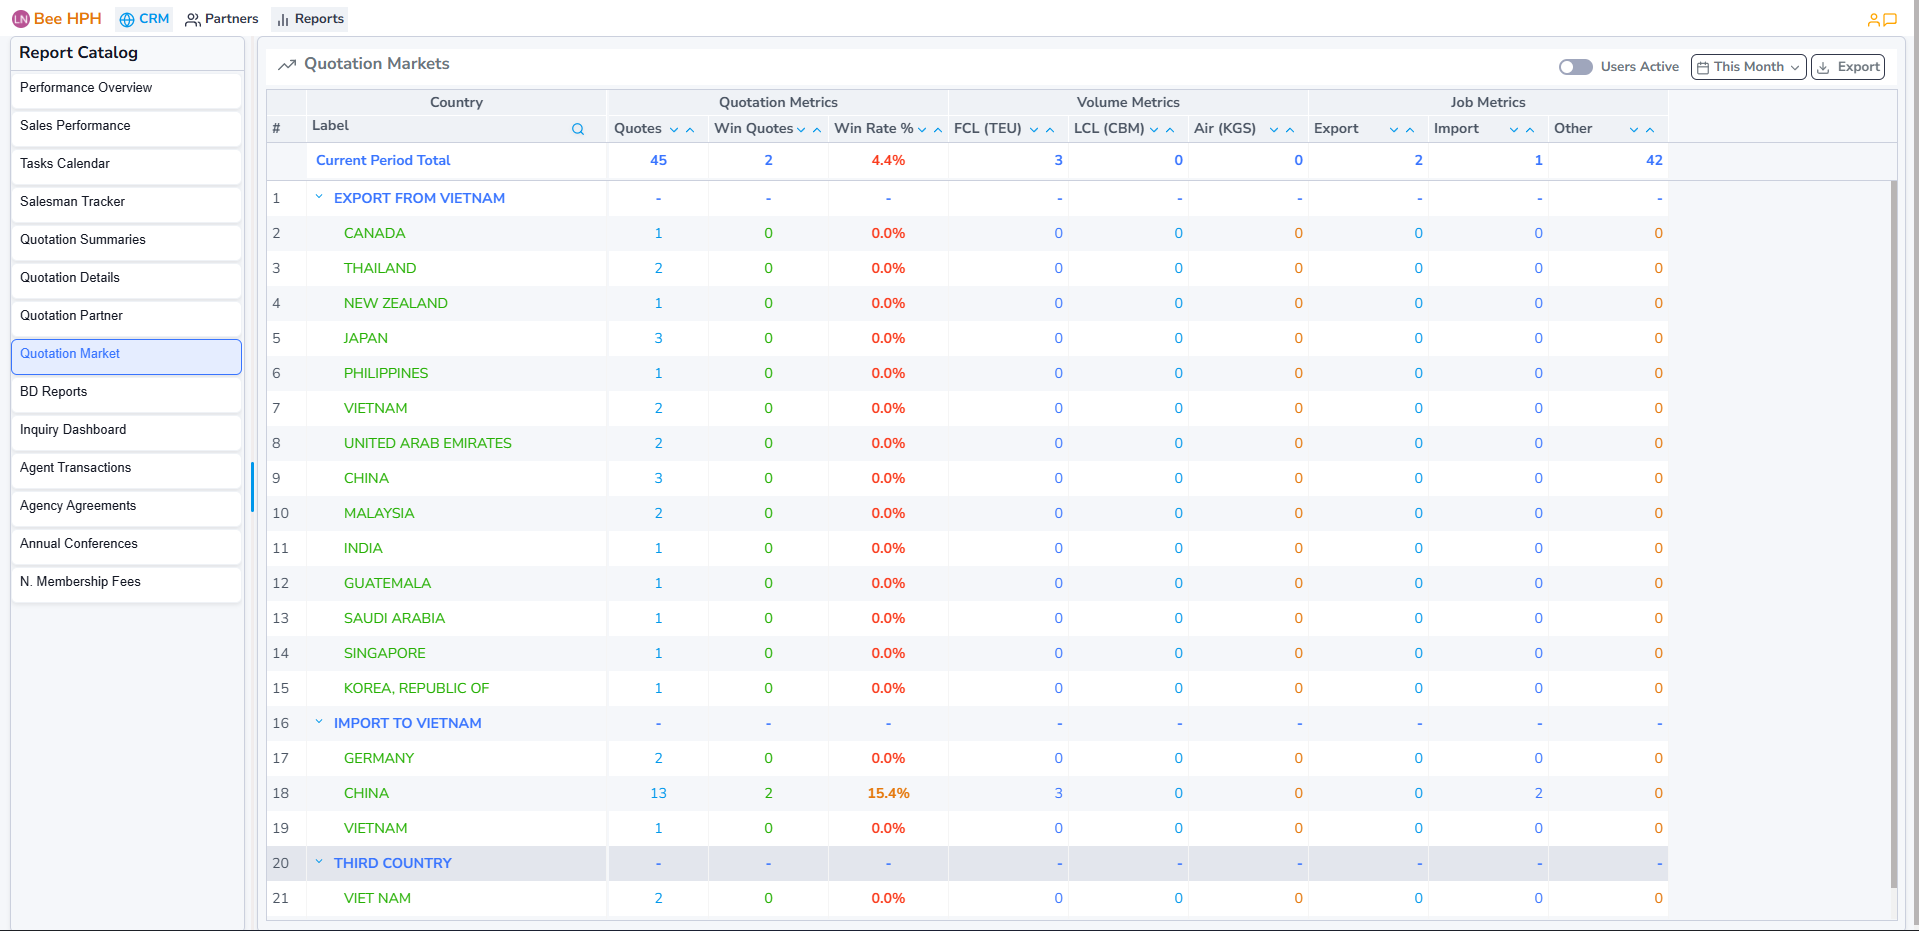
Support function bar includes:
- Users Active : Filter by active users.
- This Month : Select the report time range (default loads the current month).
- Export : Export the report to Excel (based on the data currently shown on screen).
9. BD Reports
View and track business development performance based on actual shipment volume, and compare current period vs previous period.
On the left sidebar Report Catalog, select BD Reports.
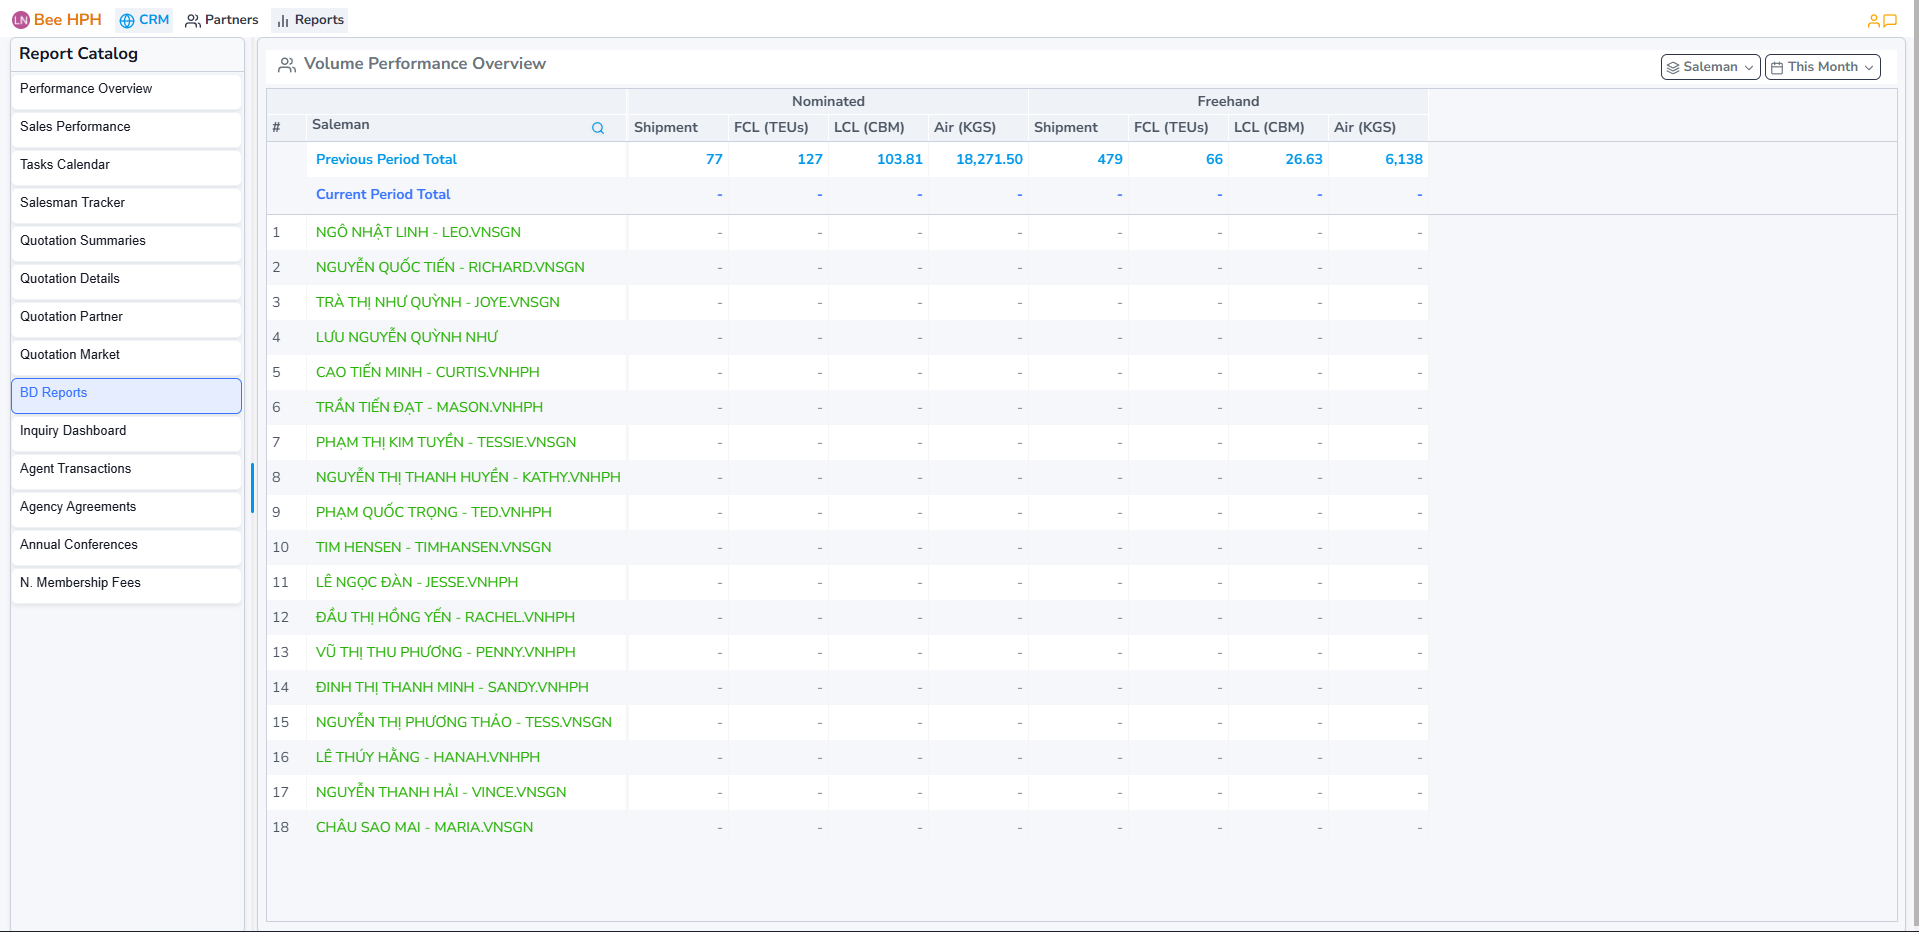
Support function bar includes:
- This Month : Select the report time range (default loads the current month).
- Saleman : Filter by data group (salesman, company, none). Default is salesman.
10. Agent Transactions
Similar to Reports - Agent Transactions but limited by branch.
11. Agency Agreements
Similar to User Reports - Agency Agreements but limited by branch.
12. Annual Conferences
Similar to User Reports - Annual Conferences but limited by branch.
13. N. Membership Fees
Similar to User Reports - N. Membership Fees but limited by branch.
14. Inquiry Dashboard
Similar to User Reports - Inquiry Dashboard but limited by branch.
Partner Overview
See detailed instructions here
Admin Dashboard
Admin - CRM Overview
1. CRM Overview
- Similar to
Company Dashboard - CRM Overview, but shows the overall view of the entire company, not limited by branch.
Admin - Pricing Overview
2. Pricing Overview
- Similar to
Company Dashboard - Pricing Dashboard, but shows the overall view of the entire company, not limited by branch.